
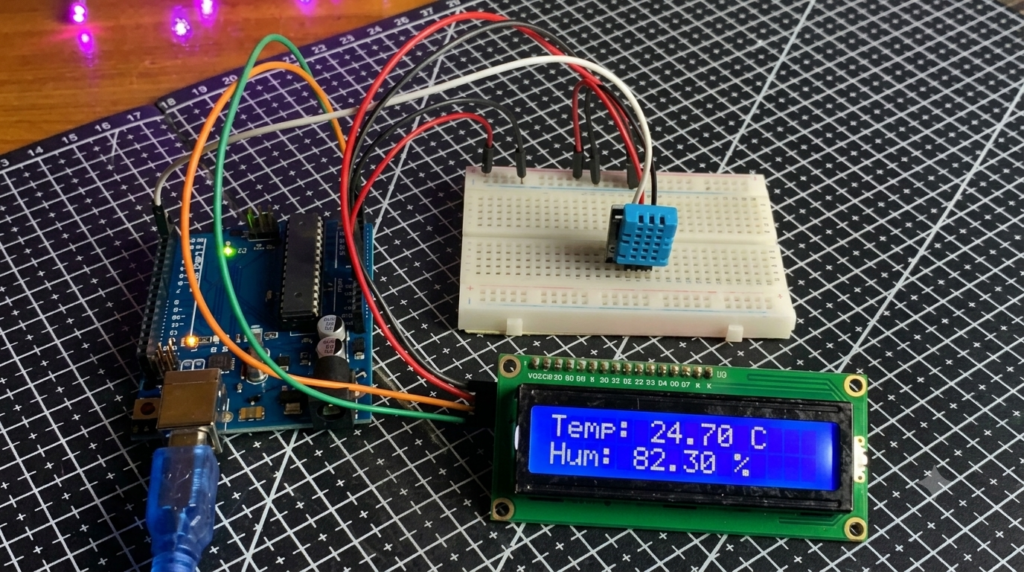
Numbers in a serial monitor are fine, but a live graph is better. In this tutorial you will wire a DHT11 temperature-and-humidity sensor to an Arduino Uno, read it with the Adafruit DHT library, and plot temperature and humidity in real time with the Arduino IDE’s built-in Serial Plotter — no extra software, no display hardware. It is the fastest way to build a data-logging mindset, and the same code pattern works for any sensor you will meet later.
Meet the DHT11
The DHT11 is a cheap digital sensor that reports temperature (0–50 °C, ±2 °C) and relative humidity (20–90%, ±5%) on a single data wire. Inside, a resistive humidity element and a thermistor feed a tiny microcontroller that speaks a custom one-wire protocol: the Arduino pulls the line low to request a reading, and the sensor answers with 40 precisely timed bits. You never have to implement that timing yourself — the DHT library handles it — but knowing it exists explains the sensor’s one big rule: it needs about a second between readings, and asking faster returns stale data. If you need better accuracy, the DHT22 is a drop-in upgrade the same library supports.
Parts Needed
- Arduino Uno with USB cable
- 1× DHT11 sensor (bare or on a 3-pin module)
- 1× 10 kΩ resistor (only for the bare 4-pin sensor)
- Breadboard and jumper wires
Wiring the DHT11
On the bare sensor, pin 1 is VCC (leftmost, grille facing you) and pin 4 is GND; pin 3 is unconnected. Module versions usually have three pins labelled +, out, and −. The pull-up resistor keeps the data line HIGH between transmissions.
| DHT11 Pin | Arduino Uno | Notes |
|---|---|---|
| VCC (pin 1 / +) | 5V | Works at 3.3–5.5 V |
| DATA (pin 2 / out) | Digital pin 2 | 10 kΩ pull-up to 5V on bare sensors |
| GND (pin 4 / −) | GND | Pin 3 stays unconnected |
Install the Library
In the Arduino IDE open Sketch → Include Library → Manage Libraries, search for “DHT sensor library” by Adafruit, and install it — accept the prompt to also install the Adafruit Unified Sensor dependency. That is all the setup required.
The Plotter-Ready Sketch
#include <DHT.h>

const int DHT_PIN = 2;
DHT dht(DHT_PIN, DHT11);

void setup() {
  Serial.begin(9600);
  dht.begin();
  Serial.println("Temperature(C) Humidity(%)"); // Plotter legend.
}

void loop() {
  float h = dht.readHumidity();
  float t = dht.readTemperature(); // Celsius.

  if (isnan(h) || isnan(t)) {
    Serial.println("Sensor error");
    delay(2000);
    return;
  }

  // Tab-separated values plot as two curves.
  Serial.print(t);
  Serial.print("t");
  Serial.println(h);

  delay(2000); // DHT11 max rate: about once per second.
}
Walkthrough
The key detail is formatting: the Serial Plotter draws one curve per number on a line, separated by tabs or spaces, and uses the first line of text as the legend. isnan() guards against the checksum failures the DHT11 occasionally returns — without it, zeros would spike your graph. Upload, open Tools → Serial Plotter at 9600 baud, and breathe on the sensor: humidity climbs immediately, temperature follows slowly. Hold a cold drink nearby and watch both curves dive.
Experiments to Try
Log an hour of data while opening and closing a window to see how slowly room temperature really moves. Move the sensor near a radiator and measure the difference between the wall and the middle of the room. Compare the DHT11 against a household thermometer: a constant offset is normal for a ±2 °C part — just subtract your measured offset in code for a calibrated reading.
Logging Beyond the Plotter
The plotter is live-only — close it and the data is gone. For real logging, keep the Serial Monitor open and copy its output into a CSV file, or use a terminal program like PuTTY or screen that can capture straight to disk. Change the print format to millis(),temperature,humidity and spreadsheets will graph hours of data for you. A 16×2 LCD (or a tiny OLED) turns the project into a standalone room monitor with no computer attached, and a single 10 µF capacitor across the sensor’s power pins noticeably reduces NaN reads on long cable runs. Each of these upgrades is an evening project that reuses this exact sketch as its base.
Troubleshooting
- “Sensor error” every time: check the pin order — on bare DHT11s, VCC and GND are easy to reverse, and a reversed DHT gets hot; unplug and let it cool.
- NaN occasionally: normal once in a while; the guard skips bad samples. If frequent, shorten wires and verify the pull-up.
- Plotter shows nothing: make sure the Serial Monitor is closed (only one can use the port) and baud matches.
- Readings frozen: you are polling faster than 1 Hz — keep the 2-second delay.
Safety Notes
- Keep the sensor away from condensing moisture (kettles, aquariums); the DHT11 measures humidity but is not waterproof.
- If the sensor ever feels hot to the touch, disconnect power immediately and recheck the wiring.
- This is a hobby sensor; do not use it as the sole alarm in fridges, incubators or greenhouses without a backup.
Conclusion
You can now sense, format and visualize environmental data with three parts and thirty lines of code. The read-guard-print-loop pattern transfers directly to pressure, light and gas sensors. When you are ready for wireless, our ESP32 weather station tutorial takes this exact sensor and puts the graph in your phone’s browser instead.
